

Democratizing Financial Intelligence
Every market. Every asset.
One lens.
AI-native financial intelligence — news, fundamentals, and market sentiment in one place. An API for builders. An AI investment advisor for everyone else.
- Markets
- US · China · Japan · Korea · Thailand · EU
- Assets
- Stocks · ETFs · Forex · Crypto · Commodities · Private
- Scale
- 34K+ stocks · 18K+ ETFs · 10K+ private companies
02 The Problem
The world doesn't lack financial data.
It lacks a way to understand it.
It was never that people don't care about the fundamentals. Understanding them is walled off — by effort, expertise, language, and a $24k terminal built by armies of human analysts. So everyone defaults to charts, tips, and headlines.
Every market speaks a different language. Literally. A Shanghai filing, a Tokyo XBRL, US news — none in one view.
Abundant but meaningless — 19 tickers named in one story, a black-box sentiment score, a 100-page 10-K.
Throw raw data at an LLM and it hallucinates — and you still don't know where to start asking.
In the age of AI, finding data was never the problem — organizing it into intelligence is. That's the wall MarketDX tears down.
03 The Solution
See it. Ask it. Understand it.
Three layers turn the world's raw data into intelligence — we organize it, reason over it, and, the part that unlocks everyone, make it something you can see.
Organize
A knowledge graph + RAG structure it — decoding filings (incl. Chinese, Japanese & Korean XBRL), linking news to the assets it moves.
Reason
AI turns structure into the "so what" — grounded, cited answers, not a black box and not a hallucination.
Visualize
Instead of a 100-page filing, you get the picture — go "aha," then drill in. The layer that makes it click for anyone.
The “organize” layer is a swarm — not a team. ~47 AI agents turn raw filings, news, options and listings into one graph, and audit their own work 24/7. Human labour ≈ 0. See the org chart →
04 Why Now
Why this couldn't exist five years ago.
Four waves just met. Reading the world's news and knowing who it moves used to take an army of analysts — the technology to do it any other way simply wasn't here. Now it is.
LLMs can finally reason.
Interpreting millions of articles causally — not just scoring sentiment — was impossible and uneconomical until the last two years. The core product just became buildable.
Inference collapsed in price.
What took thousands of analysts now runs on one human and an AI swarm for cents. The cost curve that gates the incumbents is the one we ride down.
“Just ask” is a real product.
AI assistants and MCP made asking the default way people reach data. The dashboard era is ending — and an answer engine is exactly what we serve.
Global retail woke up.
Investors across China, Japan, Korea and Southeast Asia want institutional-grade intelligence, and alt-data spend is compounding 60%+ a year. The demand finally caught up.
The window is open now — not in 2020, and not once the giants adapt. The tools to build this arrived this cycle; the audience arrived with them.
05 Market
Four markets are collapsing into one.
The $49B market-data business isn't being replaced — it's being absorbed into an AI-native intelligence layer, pulled together with alt-data, robo-advisory and AI agents. MarketDX is built for the category they're converging into.
The data-made-usable category — market data $49.2B converging with alt-data, robo-advisory and AI agents, compounding into the early 2030s.
The slice our two products serve — an AI advisor for retail investors and a data API for developers & funds. Excludes the institutional terminal seats we don't chase.
Our multilingual beachhead — CN·JP·KR·TH, where incumbents are weakest. Bottom-up below.
How the SOM is built — bottom-up, not top-down
China's ~240M investors are large but gated (multi-account inflation + tightening foreign-access rules) — kept as upside, not in the base. ARPU and penetration are labelled assumptions; every market figure is sourced.
Sources: Burton-Taylor / TP ICAP (market data $49.2B, 2025) · Grand View / Fortune Business Insights (alt-data) · Mordor / Research&Markets (robo-advisory) · MarketsandMarkets / Grand View (AI agents) · CSDC · Japan FSA · KSD · SET (investor counts) · Seeking Alpha / Morningstar / Danelfin (pricing).
06 Product
See any market — in one picture.
The graph becomes something you grasp in seconds and drill into — a company's financials, a theme's winners and losers, your whole portfolio. The picture is what a wall of chatbot text can't give you.
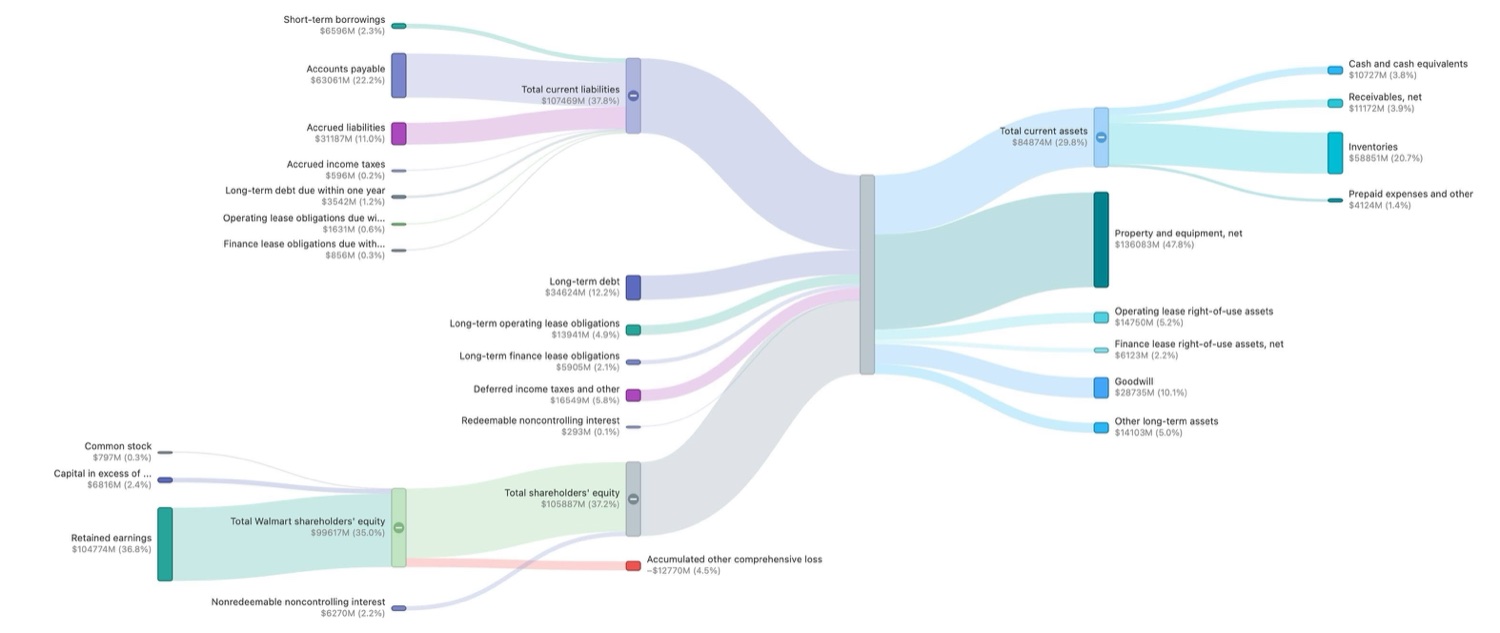
See a company's balance sheet flow — where every dollar sits, at a glance.
The hard question
But can you trust AI-made data?
Yes — and here's the proof.
The instinct says humans are more reliable. Our experience says the opposite: we buy human-curated data — and it arrives full of mismapping, noise and errors our swarm cleans. We're not asking you to trust AI over people — we're showing you AI cleaning up after the human-made data everyone already relies on.
The entire ⚖ auditor bench in our diagram exists because the human-made data we bought was wrong. Figures queried from production — they only grow.
Not “prompt & store.” Every judgment passes five layers — and correctness is guarded by structural invariants (accounting identities, dedup math), not by a model's confidence. Is it perfect? No. But the honest comparison isn't AI-vs-perfect — it's AI-vs-the-human-made data we measure against. And on that, it isn't close.
07 Business Model
Build the graph once. Sell it three ways.
One engine, three revenue lanes — the same impact graph earns from investors who just ask, developers who build on it, and platforms that embed it. Each lane feeds the next.
AI Advisor
Just ask.
For investors & advisors. Ask any market question in plain language over MCP or the web — get the reasoned answer, not a wall of text.
Data API
Build on the graph.
For developers & quants. Query structured per-stock impact, megatrends and the graph directly — SDK, REST, one pip install.
Redistribution
Embed & redistribute.
For fintechs & institutions. License the graph into your own product and serve it to your users at scale.
An ACV ladder that compounds. The Advisor proves the data to a wide audience → developers adopt the API → platforms license it for redistribution. Bottom-up reach funds top-down deals.
08 Traction
Live, public — already at scale.
The graph is queryable today, and the swarm runs ~1,650 new articles a day. Backfilled to January 2026, it holds:
55,000+ listings · 6 markets (US · China · Japan · Korea · Thailand · EU) · 6 asset classes · 5 languages
09 Competition
The field scores the news. We explain it.
Every incumbent ultimately outputs a number — a sentiment score — or an event label. MarketDX outputs an interpretation: which asset moves, which way, through which causal channel, why, and what it ripples to.
| Capability | Raw news APIs NewsAPI · Marketaux · Benzinga · Finnhub · Polygon · EOD feeds | News analytics RavenPack · Accern · Bloomberg · LSEG | MarketDX the impact graph |
|---|---|---|---|
| Raw articles + ticker tags | ✓ | ✓ | ✓ |
| A sentiment score (a number) | ✓ | ✓ | ✓ |
| Which ticker actually matters | ◐ | ✓ | ✓ |
| Causal reason per stock — the “why” | ✗ | ✗ | ✓ |
| Direction + causal channel (aspect) | ✗ | ◐ | ✓ |
| Investable megatrend map + ripple | ✗ | ◐ | ✓ |
| Competitor / peer graph | ✗ | ◐ | ✓ |
| Private / off-coverage companies | ✗ | ◐ | ✓ |
| Multilingual incl. CJK filings | ◐ | ✓ | ✓ |
| Real-time / sub-second latency | ✓ | ✓ | ✗ |
| Deep multi-year history | ◐ | ✓ | ✗ |
Where we don't win — yet
We're LLM-interpreted, so we're not a low-latency wire — an HFT desk shouldn't trigger on us. Our causal history is recent, not a 20-year archive. And we're deliberately narrow-and-deep, not wide-and-raw. We say this on the record.
The closest name
RavenPack. Truly an analytics layer — event categories, sentiment scores, a private-company graph. But its atomic output is a score + an event label. Ours is a per-stock causal judgment on an investable-trend graph. A different kind of data.
10 In action
“Can't I just ask ChatGPT?” You will — it'll call us.
MarketDX isn't a chatbot rival — it's the tool the chatbot calls. On its own, a general LLM hallucinates the specifics: the price level, the options positioning, your portfolio's math. With MarketDX behind it, the answer is true. Four real questions, answered live:
You ask “How is my portfolio doing?”
Reads your actual owner-scoped book: +115.9%, Sharpe 1.18, attribution to the cent — and flags what you missed: “you call it an AI conviction bet, but your gains came from Gold +183% and Copper +56% — the AI names added 0.09%.”
ChatGPT guesses your numbers. We compute them from your real book — and catch what you didn't see.
You ask “How is NVDA doing right now?”
Four lenses in one call: price $207, −12% from its peak, vol normal for its own year · scored news (Data Center +92% YoY, $80B buyback; AMD–Microsoft as a competitive negative) · options positioning · and peers, so you know it's the whole sector, not just NVDA.
ChatGPT reads yesterday's headlines. We read the price, the positioning and the peers — today.
You ask “What are options saying on NVDA?”
Computed from the live chain: market-makers positioned to dampen today's swings, price pulled toward ~$205, bets lean bullish — yet traders pay up unusually for downside insurance. A real divergence, not a vibe.
Ask ChatGPT for NVDA's max-pain and it makes one up. Ours is computed from the live options chain.
You ask “Who really benefits from the AI-datacenter boom?”
Surfaces the ripple you'd never screen for: an AI datacenter uses ~10× the copper of a normal one — the graph ties the datacenter trend to copper, a 2nd-order winner, from real scored news.
ChatGPT lists the obvious. We surface the ripple — like copper riding the datacenter boom.
11 The Moat
The industry runs on armies.
We run on a swarm.
Bloomberg, S&P and the rating agencies employ tens of thousands of people to produce financial data by hand — which is why it costs $24k a year and stays gated. We produce comparable depth with an AI swarm and one human. A structural cost advantage that compounds.
Tens of thousands of human analysts
One AI swarm · ~47 agents
- Tens of thousands of data & analyst staff
- Hand-maintained mapping tables · slow to expand
- High fixed cost → $24k/yr, gated to institutions
- One human + ~47 AI agents
- A self-auditing swarm — AI checks AI, 24/7
- Near-zero marginal human cost → open to everyone
Rich and cheap
Incumbents are rich but costly, or cheap but shallow. We sit in the empty quadrant — rich AND cheap. It compounds: an accumulating labeled dataset, a taxonomy that deepens each cycle, a self-auditing quality loop, coverage no feed has.
Built for the agent era
As AI agents become how people touch markets, an ungrounded answer is a liability. We're the structured, causal, cited graph agents reason over — inside the agent's toolset via MCP. The default financial-context tool, compounding as the ecosystem grows.
The team
One human. The rest is AI.
It runs like a fifty-person data shop — but it's one founder and an AI swarm. Even the engineers who build the workers are AI. This is the recursion that makes the margins real.
- Brief Writer
- Translator
- Extraction Specialist
- News Classifier
- Asset Tagger
- Triage Officer
- Impact Analyst
- Theme Mapper
- Ripple Analyst
- Entity Resolver
- Backfill Supervisor
- Search Curator
- Asset-Type Auditor
- Dedup Auditor
- Japan Analyst
- GICS Classifier
- Delisting Officer
- Trend Classifier
- Node Specialist
- Conglomerate Analyst
- Mapping Auditor
- Skip Auditor
- Coverage Lead
- Trend Architect
- Value-Chain Architect
- Cross-Sector Architect
- Staff Writer
- Illustrator
- Localizer
- Editor
- Managing Editor
- Fact-Checker
- Filings Analyst
- Footnote Analyst
- MD&A Analyst
- China Filings Specialist
- Standardization Analyst
- Composition Analyst
- Breakdown Analyst
- Cross-Ref Investigator
- Anomaly Diagnostician
- Anomaly Adjudicator
- KPI Analyst
- KPI Reconciler
- KPI Auditor
- Campaign Manager
- Community Manager
47 AI agents run the whole operation. Almost none of it is human.
Meet a few of the standouts
Judges every article against every stock it names — direction, the causal channel, how central, and a one-line reason. Not a sentiment score; an analyst's verdict.
A story names 19 tickers; it surfaces the 1 that actually matters and kills the noise — before anything gets scored.
Two agents in a chain: one flags a suspicious number and forms a hypothesis; the other only changes it on hard evidence from the filing. Confirm-before-change.
Maps a diversified group (Mitsubishi, Ping An) across the whole taxonomy using world knowledge — it knows their real business segments better than the filing does.
There's no issuer-id in the data, so it merges an ADR with its home line by reading names, ISIN, exchange and currency — so market-caps never double-count.
Audits another agent's KPI-conflict rulings — an auditor that audits the auditor. The quality loop, two deep.